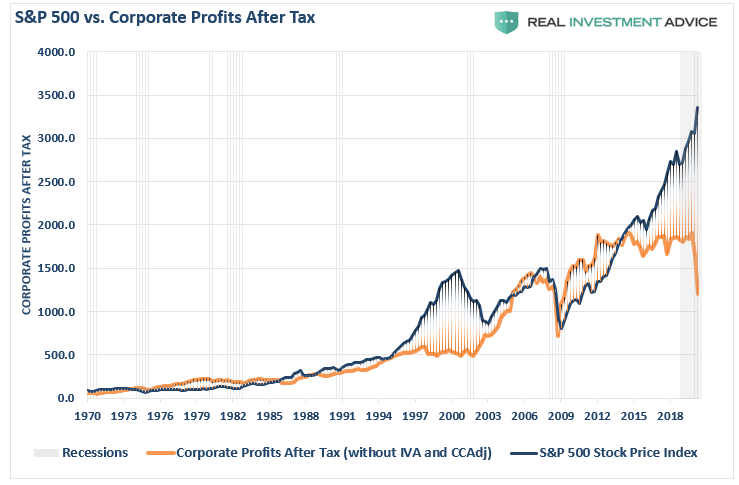
Click here if these just look like random letters to you! VALUATIONS MATTER: Top 4 US equity market valuation indicators, updated weekly with commentary. S&P500 HITS ALL TIME HIGHS… meanwhile the economy is still in the toilet. BETCHA DIDN’T KNOW… corporate profits have been flat for years. What has driven profit growth in the S&P500? Buybacks, lower tax rates, and other forms of financial engineering. Mainly buybacks. What are buybacks? Learn more in our knowledge base. The graph below shows the S&P500 storming higher (blue) while corporate profits after tax have been flat and now declined as a result of the recession. Food for thought.
OK BIG TECH DOMINATES, NOW WHAT? There is still plenty of long term investing opportunity in the US. To begin, we have seen growth businesses (like Facebook, Google, and Amazon) dominate the markets the last 10 years. Since the end of 2016, growth stocks have returned ~100% whereas value stocks (knowledge base) have returned just 15%. COVID19 IS NOT A FOREVER EVENT. The S&P500 may be hitting new all time highs but many sectors are not doing well and that is where the medium/long term opportunity exist. The most basic question to ask yourself is this: are people really never going to eat out again? Are we really never going to use gas again? Are banks becoming worthless companies that provide no value? Are humans not social animals that thrive on social contact? Will we really never, ever leave the house again? PERFORMANCE OF SPECIFIC SECTORS OF THE S&P500: Energy Sector (XLE) – Still down 38.64% year to date due to changes in demand for oil during COVID. The risks are very real yet it presents an interesting opportunity in the long run. Real Estate Sector (XLRE) – This ETF tracks the real estate sector and is still down 8.10% year to date. Real estate presents strong investing opportunities but requires careful vetting to avoid the massive risks with commercial real estate like office buildings. Equal Weight S&P500 (RSP) – This ETF tracks all stocks in the S&P500 equally so each of the 500 companies in this index carry a 0.23% weight in this fund. As a result, this ETF is still down 10.58% year to date and has been generally stagnant since 2018. High Dividend S&P500 Fund (SPYD) – This ETF invests in 60-80 high yield S&P500 stocks that includes companies like General Mills, Gilead Sciences, and AbbVie. This fund is underweight tech and overweight many industries that have fared poorly in the pandemic. Still down 28% YTD with a 5.98% dividend yield, this could present a buying opportunity for investors looking long term and beyond the COVID pandemic. BOTTOM LINE: History shifts and an investment that delivers strong returns one decade may not deliver strong returns the next decade. During the height of the Dot Com Bubble in March 2000, growth stocks outperformed value stocks over the prior 1, 5, 10, and 15 year periods. By March 2001, value stocks regained the advantage over every one of those periods. With valuations in tech stocks as high as they are today and Congress eager to further regulate and potentially break apart these large tech businesses, we’re personally balancing our portfolio with strong value stocks/ETFs that are quite cheap relative to tech stocks instead of doubling down on extreme valuation tech stocks. Now, if tech stocks go back on sale like they did in March 2020, there may be some good opportunities but for now… probably not. |
|---|